S&S SOFTWARE SERVICES
CHARTMASTEREODRT-DATA
S&S SOFTWARE SERVICES
CHARTMASTEREODRT-DATA
web site :
www.chartmastereodrt.com
END OF
DAY & REAL TIME DATA VENDOR
EOD
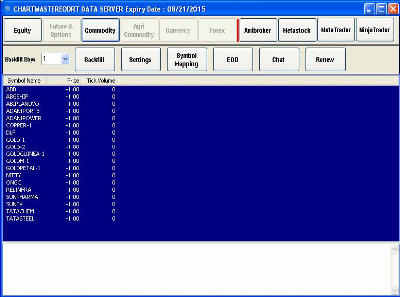
DATA : NSE-EQUITY, FUTURE, CURRENCY, BSE, MCX,
NCDEX, GLOBAL-INDICES, FOREX, NASDAQ
REAL
TIME DATA :
NSE-EQUITY, NSE-FUTURE&OPTION, MCX, NCDEX,
CURRENCY-MCX&NSE, FOREX
email :
chartmastereodrt@yahoo.com
Mobile No. : 9330121112
Hello and Welcome to the home page of S&S Software Services team. We invite you to
take a look through our web site and get to know about us our services and our
products better than others. We trust that when you leave, you will have a much
better understanding about our Client.S&S Software Services is a one of the leading
data providing Company in India.
Multiple Exchange:____________________________
* Indian Exchange: NSE/BSE/NSE-FUTURE/NSE-INTRA
* Global Exchange: INDICES,
NASDAQ, FOREX
* Commodity Exchange: MCX,
NCDEX |
Projected data
* End-Of-Day(EOD)
* Intra-Day(IEOD)
* Real-Time(RT) |
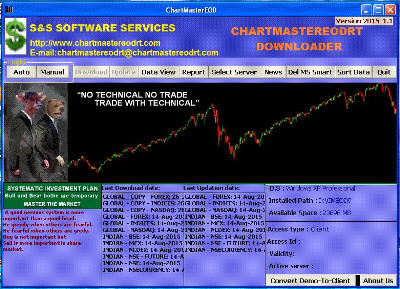
About Techenical Analysis
A technical analyst doesn't look at income statements, balance sheets, company policies, or
anything fundamental about the company. Technical analysis looks at the actual history of
trading and the price of a security or index. This is usually done in the form of a chart. The
financial product can be a stock, future or an index. The technical analyst believes that
securities move in trends. And these trends continue until something happens to change
the trend. With trends, patterns and levels are detectable. Sometimes the analysis is wrong.
However, in the overwhelming majority of instances, it's extremely accurate. Technical
analysis is stock market research of price action over time and charts are what an analyst
works with as their primary record of price action. Behind every price is an investor who
had a reason for buying or selling. Traders generally act alone but often their weight of
numbers has a direct influence on short term prices Researching the stock market with
charts and technical indicators is the study of group behaviour and sentiment. It is done
with science and art. We use science because we use mathematical formula, computers
and statistics. Charting is the study of price action of a market itself as opposed to the
study of the goods in which a market deals. Technical analysis is simply a different means
of using stock market research to arrive at the same investment objectives.
These goals may be summarised as:
* To gauge the relative strength of buyers and sellers;
* To identify preferred times to buy and sell;
* To develop a theory as to how far price may reasonably be expected to
move.
* To formulate a risk strategy.
How Can I Help
We give extra technical tools which have many plug-in that help trader to
buy and sale security at proper place and proper time which
gives maximum gain. This product
automatically calculate support resistance and private point of various type
market (cash future
option For Intraday and Delivery Trade) and generate various signal of each
market to minimize market risk .
Copyright
(reserved) |
Data compatible to the
structure of Metastock/Advance Get/Eleave/Omnitrader/Ami Broker/MT4/Metatrader/Ninja |